XiaoyaoClaw Usage Report
Answers "how long, which tools/skills/models, how many tokens" per agent task — parses local session JSONL directly, zero deps, data never leaves the machine.
Product Introduction
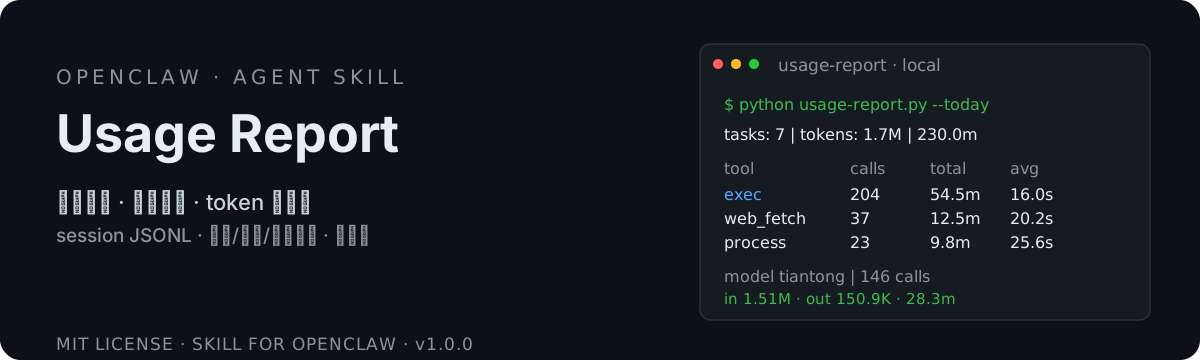
OpenClaw Usage Report removes four blind spots: no idea how long a task takes, no data on which tool (exec / web_fetch / process) is the bottleneck, no clarity on token usage per agent/model, and no visibility into which skills get used. The data exists — local session JSONL (state/agents/*/sessions/*.jsonl) records every task/tool/model timestamp and token. This tool consumes it directly: task duration (window + active excluding user think-time), real token use = input + output (avoiding totalTokens which includes cacheRead and inflates 1.3x–14x+ in practice), per-agent/model aggregation, tool latency (count / fail / total / avg / slowest) for bottleneck ID, skill usage inferred from read calls, daily input/output trends, MCP tools covered by construction (same shape as regular tools). Compared to claw-lens (Node web dashboard): zero-dep Python single-file CLI, drop-in, terminal tables + JSON for cron/CI. Optional --today --json for daily-recap cron. Pure stdlib, no external deps, no uploads.
Core Features
- Task duration — window + active (excluding user think-time)
- Model tokens — per-agent/model aggregation (calls, in/out; real = in+out)
- Model latency — approx via event ts gap (cap 10min), per-agent/model aggregation
- Tool latency — per-tool: count / fail / total / avg / slowest → instant bottleneck ID
- Skill usage — inferred from read calls: skill name, count, using agent
- Daily trends — daily in/out tokens, call counts
- MCP tools — same shape as regular tools, covered by construction
- Zero-dep pure local — Python stdlib, no deps, no uploads
- Cron daily-recap optional — --today --json for scheduled jobs, opt-in